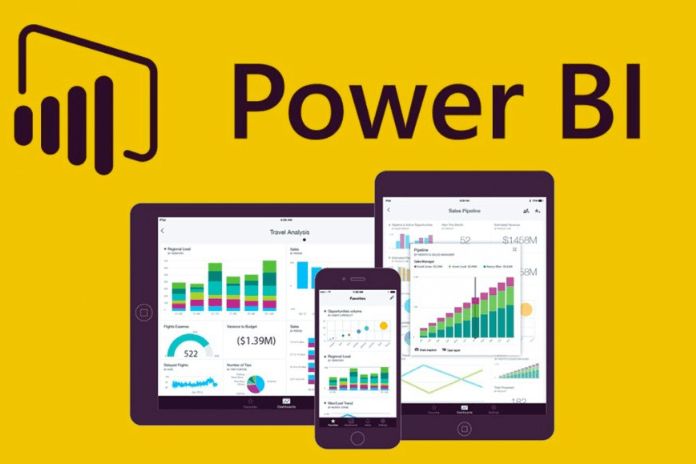
Self-Service BI: From Excel To Power BI

Anyone pursuing the idea of self-service BI not only wants to create colorful graphics but also wants to evaluate their data themselves. The first step is usually Excel – until you reach its limits. To get ahead, using programmed VBA macros and outsourcing work steps to prepare or merge data is often necessary.
It seems easier to achieve self-service BI via a system developed precisely for this purpose.
Self-Service BI With Solutions From Microsoft
If you search the Internet, you will quickly find a solution from Microsoft: Power BI. The first try of Power BI shows that some things are easier to handle and that open requests are covered. Power BI is also closely linked to Microsoft Excel. Extensions like:
- power query,
- power pivot,
- Powerview,
- power maps
They are partly directly available in Excel. For the exciting and usually more complex use cases, it is recommended to work with Power BI Desktop or the cloud service Power BI Service since Microsoft has combined all Power BI extensions from Excel in one solution.
Efficient Structuring Of Data
The possibilities in Power BI to use desktops for structuring and merging data (data modeling) are easier to use than in Excel and leave nothing to be desired. For example, the merging of Excel or CSV files into a data set is solved by reading Power BI in all the data. If new files are added, the data that has already been read in is available for the next update.
If there are multiple data sets, Power BI (with identical names) automatically recognizes the relationships. A manual check, correction and supplementation of the identified associations can be done manually. For this, Power BI uses the syntax/language M. If the graphical interface options are insufficient, extensions can also be programmed with it.
ALSO READ: How To Reach Your Goals With The SMART Method
Analyze And Visualize – Simultaneously
Power BI offers a variety of visualizations, which can also be expanded to include representations from the community or third-party providers. Statistically demanding questions can also be implemented by integrating the R programming language. The formula language DAX (Data Analysis Expressions) is used to calculate new vital figures.
Similarities with well-known Excel formulas are wanted here, removing the fear of complex questions. Overall, Power BI is suitable for simple and quick evaluations. Complex solutions can also be created with it, but this requires a broad, in-depth understanding of databases, data modeling and programming, which often only IT specialists have.
An Economical And Practical Tool
BI self-service is a powerful lever for democratizing BI at all company levels.
- These BI solutions are designed to easily connect with many data sources familiar to business specialists (Excel, SharePoint, your CRM, your ERP, Google Analytics, Google Data Studio, etc.). No need to be a developer or a Python pro!
- It is a very accessible tool to get started in data visualization, in other words, the visualization of data through graphs, maps and others to make them easy to understand.
- Plus, they quickly scale as the adoption rate increases. Server capacity can be added without causing access issues or requiring dedicated IT support.
- In addition, eliminating data warehouses and license fees associated with databases dramatically reduces operating costs.
Why Choose BI Self-Service?
A Significant Gain In Agility
Companies using traditional business intelligence tools are limited in their effectiveness. The production of reports or dashboards is very time-consuming and a source of delays in providing information, preventing rapid decision-making. On the contrary, self-service BI tools allow teams to promptly create user interfaces and report reports. Working with data is simplified and requires little technical expertise.
Profit?
- This saves users considerable time during their data collection and analysis, which they can reinvest in creating an impactful report.
- Therefore, each business team can create dashboards and reports that help it monitor its key indicators (or KPIs).
- And that’s how she can make strategic decisions more quickly. The entire organization gains in efficiency and agility.
