Anomalies In Data, How To Find Them With Machine Learning
Which parameters are used to recognize it, and which approaches are best to follow? What is the difference between global, contextual, and collective outliers? Usually, detection in data is one of the possible applications of machine learning and is used to identify and stop fraud, cyberattacks, and intrusions. Identifying outliers takes effort and organization.
When we talk about data anomalies, we often refer to an abstract discourse. To better understand what it is, it is necessary to define the very concept of an anomaly, which parameters are used to recognize it, and which approaches are best followed. Machine learning is used for anomaly detection because, by its nature, it offers countless advantages.
Anomaly Detection And Machine Learning
An anomaly, as the name suggests, is something that varies from the norm. In the specific literature, it is also referred to as “variation” or “exception,” and, in fact, it is an event so unusual that it can generate suspicion. It could be a change in the traffic of a company network. This operation slows down the fluidity in the execution of software, an exceptional banking transaction compared to the average of those ordered by a customer, or an atypical online purchase compared to the customer’s habits. Buyer.
The fields of application are varied, and, with increasing emphasis, machine learning is used to find anomalies in the healthcare sector in order, for example, to detect the worsening of the health condition of a person or the onset of pathology. This discussion takes on its depth if applied to a large number of people or different groups subjected to experimental treatments.
Because companies create large amounts of data, industry-specific machine-learning models are needed to find anomalous data. Being able to identify anomalies offers countless advantages, for example, predictive maintenance, where recording, identifying, and labeling data as anomalous allows you to intervene before a fault stops an industrial production line, a train, or the regular supply of an aqueduct.
It is necessary to make a reflection that goes beyond the use of technologies and to underline that the detection of anomalies takes on a first-rate role above all because it allows for in-depth knowledge of the data that a company (an institution or an organization) has at its disposal. An anomaly can also be understood with a positive meaning, for example, of an industrial machine whose cylinders usually need to be replaced every three months.
Data analysis can highlight that, despite the deadline for replacement being close to expiring, the cylinders still show no signs of deterioration. Knowing this helps the company not to intervene where it is not necessary and to make other types of considerations, perhaps linked to the reduced need to use machinery and the optimization of the fleet of tools used for production. Depending on the type of data, there are methods to build anomaly recognition models using machine learning based on labeled data and raw (i.e., unlabeled) data.
Models trained on labeled data observe values that vary from a threshold expressly specified by those training the machine learning. In contrast, models that use raw data classify them to find outliers in data clusters. In other words, data is grouped based on homogeneous elements or values, effectively based on their similarity. In both cases, machine learning models recognize those that can be defined as acceptable behaviors (or data) and those that are not and can be considered abnormal.
The Types Of Anomalies
The anomalies are of different types here. We examine them by macro-groups:
- Global outliers
- Contextual outliers
- Collective outliers
Anomaly detection for global values falls within the scope of those data that go outside the limits established by the data previously collected and analyzed. For example, the corporate customer of a bank generates an average monthly movement of 300 thousand euros and suddenly generates an amount five times higher. Contextual values follow a similar logic but within a limited framework. It may, for example, be a strange value recorded in the data of a patient taking a specific drug or an inconsistent value recorded by a machine placed under certain stress conditions.
A sudden and inexplicable decline in the logistical potential of all the branches of a multinational in the same period of the year is a revelation of collective anomalies. These are examples reduced to the essentials to make the concepts expressed accessible, but, in reality, the detection of anomalies is a more complex discipline the more numerous the data is.
Data Types And Anomalies
The term “data” is a container, a generic definition that is interpolated between synecdoche and metonymy, which increases its granularity by taking into account some characteristics, including:
- data type
- type of processing
- data labeling methods
- scope of
There are structured, unstructured, and semi-structured data, i.e., macro-groups, which in turn have peculiarities and which include text, image (or video), and audio data and, digging further into the various levels of abstraction, you can find time series data, i.e., sets of information that vary over time, such as, for example, analyzes of the sales of a product limited to a quarter, two months or during specific days of the year.
The type of data you work with dictates, among other things, the strategy by which you examine and identify anomalies. The type of processing is primarily attributable to online and offline methods. The latter finds application when you have all the necessary data. At the same time, online processing makes thoughtful sense when data continues to arrive, perhaps collected by serial polling procedures, and you need to be able to find anomalies in near real-time.
Data labeling plays a role in identifying anomalies, which can be classified into supervised, unsupervised, or semi-supervised machine learning modes. This topic is often a precursor of discussion and misunderstandings. In reality, even unlabeled data can indicate anomalies, so much so that it is one of the most used machine learning methods because it does not require training data.
Finally, anomalies must be contextualized in the scope of application. Each sector evaluates them according to proprietary rules, and these, in addition to depending on the labeling and type of data, must also be contextualized based on the type of processing. For example, to identify anomalies among the data detected by sensors, an analysis of historical information is required, while the detection of anomalies in the vision of a robotic agent requires data relating to the lighting conditions of a limited area and at a specific moment.
Difficulties In Detecting Anomalies
Being able to identify anomalies is a process that requires statistical analysis, and this requires a sample of data sufficient for training and good quality. Last, but not least, it requires a culture oriented toward the recognition of false positives. It goes without saying that the most crucial element in anomaly detection is data, which must be of good quality and must be in sufficient quantity to allow the training of machine learning models.
The constant is simple: a more significant number of quality data allows for better detection of anomalies, but since the depth of the topic is considerable, other factors come into play. As we have seen above, the term “data” is not exhaustive and requires a contextualization that varies depending on the type of information, its granularity, and the presence or absence of labels.
To establish whether, over time, there are historical moments in which a foreign currency devalues against another currency, to carry out accurate analyses, it is necessary to have ten-year historical data sets of money markets. After examining the quality, granularity, labeling, and historicity of the data, it is possible to establish which type of algorithm to use for detecting anomalies.
Having qualitatively and quantitatively appropriate data is not in itself sufficient; false positives must also be taken into account in unbalanced data distributions. Once an anomaly has been detected, it is necessary to investigate to be sure that it really is such, and, nevertheless, it must be evaluated from the perspective of the unbalanced distribution of data, a problem mainly felt in machine learning.
This is an aberration of the sample of data available: assuming we use the data of transactions carried out by credit cards by bank customers, it is reasonable to expect that 99.99% of these are regular and that only 0.01 % have a fraudulent origin. Training a model for the recognition of illicit transactions using a sample of data in which these are poorly represented is far from obvious.
Anomalies And Machine Learning
Anomaly detection methods depend on the type of data available; however, at present, those subordinated to unsupervised learning prevail rather than those attributable to supervised learning, and the reason is easy to explain. In the case of supervised learning, machines learn to recognize anomalies starting from specific instructions that indicate which data are to be considered normal and which are anomalous so that they can be identified by executing specific algorithms.
To use an example, it lends itself well to temperature analysis. Using a data set of temperatures over the last hundred years in a given geographic area, it is relatively easy to assign parameters above or below, which can be considered abnormal. Once the rules have been set, the algorithms examine all the available data, identifying those that are outside of normality.
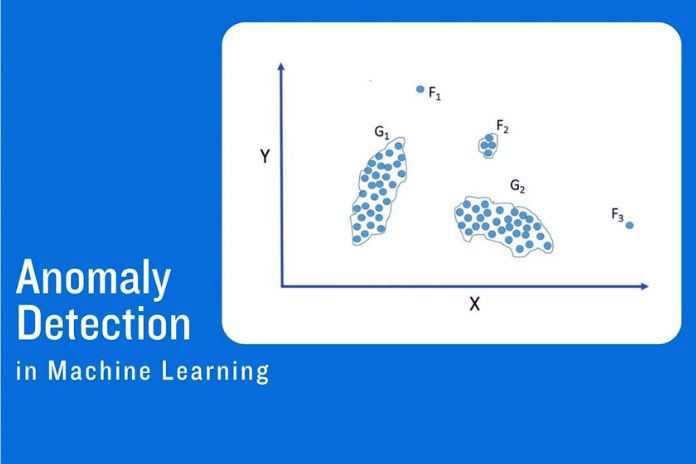
The unsupervised approach is used when the very concept of anomaly cannot be determined from the start. In these cases, machine learning techniques such as clustering are used, which allows homogeneous elements of a data set to be selected and grouped. This results in clusters in which some similar data and clusters contain very different data.
Since data labeled anomalous is usually quite rare, most anomaly detection activities rely on unsupervised algorithms, which, however, can return false positives or identify anomalies that are not relevant. While supervised learning mainly uses labeled data and unsupervised learning uses unlabeled data, semi-supervised learning allows you to use both.
Since humans typically perform labeling, this learning becomes practical when datasets are enormous. The recognition of anomalies is a topic of current affairs and discussion which, even today, is addressed with methodologies and algorithms already in vogue a decade ago. This is an indication of the complexity of the topic.